Police Misconduct Settlements Data Analysis
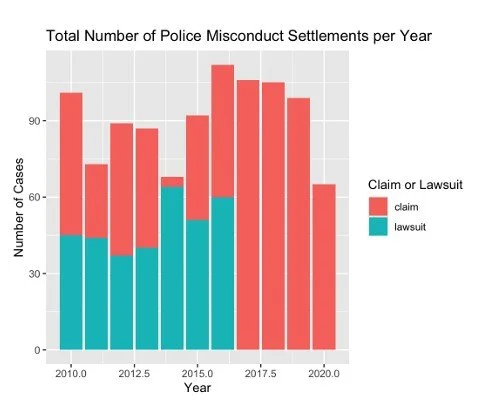
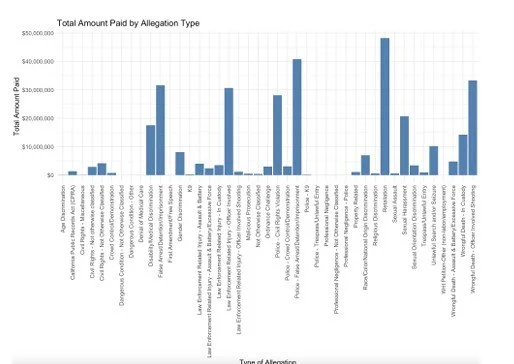
This project examined police misconduct settlement data from Los Angeles between 2010 and 2019 using R and data visualization tools including dplyr, ggplot2, and plotly. Working with data compiled by FiveThirtyEight and The Marshall Project, I analyzed trends in settlement frequency, allegation categories, and total settlement amounts over time.
The project allowed me to explore how data analysis can support transparency and public understanding of institutional accountability. In addition to technical skills in data cleaning and visualization, this work strengthened my understanding of the ethical considerations involved in working with incomplete, sensitive, and socially impactful datasets.
The Cost of Misconduct: Unraveling Police Settlements in Los Angeles
Imagine you’re walking through a bustling city, each step echoing the hustle and bustle of urban life. Now, pause and think about the unseen currents beneath this city’s surface — the stories that don’t make the front page, the quiet transactions that shape justice and accountability. One such story is about police misconduct settlements, an iceberg of financial and moral implications hidden beneath the surface of our cities. Let’s dive into the depths of Los Angeles, examining the waves of police misconduct settlements from 2010 to 2019, and see what the data reveals about this complex and pressing issue. Police misconduct settlements are a costly consequence of the misuse of power by law enforcement officers. These settlements, paid by taxpayer money, reflect a financial burden. By examining a dataset compiled by FiveThirtyEight and The Marshall Project, I can uncover trends and insights into the nature and financial impact of police misconduct settlements in Los Angeles. This blog post aims to tell the story behind these settlements.
This journey begins with a dataset compiled by FiveThirtyEight and The Marshall Project … Read More
Project Details
Course: LIS 572 – Introduction to Data Science
Professor: Pramod Gupta
Institution: University of Washington Information School
Tools Used: R, dplyr, ggplot2, plotly
Dataset Sources: FiveThirtyEight and The Marshall Project
Key Topics: Data visualization, ethical data analysis, statistical analysis